Parabola Plotting Web Pages
Thanks to HTML5, graphics is now available on web pages.
Using this feature to design parabolas, is as an
example of what is now available.
Different applications require parabolas having different
focal points. For convenience, let focal length be define
relative to the parabola's radius. The old camera flash
bulbs use to use a parabola similar to above. Parabolas
follow the equation below.
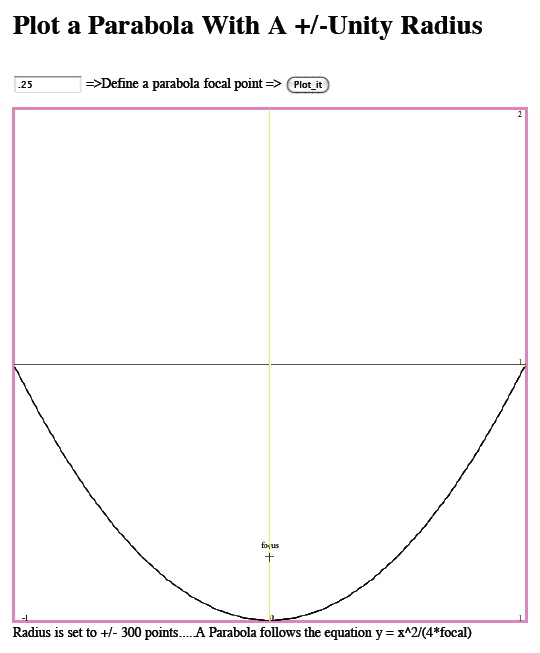
y = X^2/(4*focal)
When the focal is .25, y will be one when x is one.
This webpage allows a focal point to be entered
and it will do all the plotting.
Something like a solar cooker might require a focal
length more like shown below.
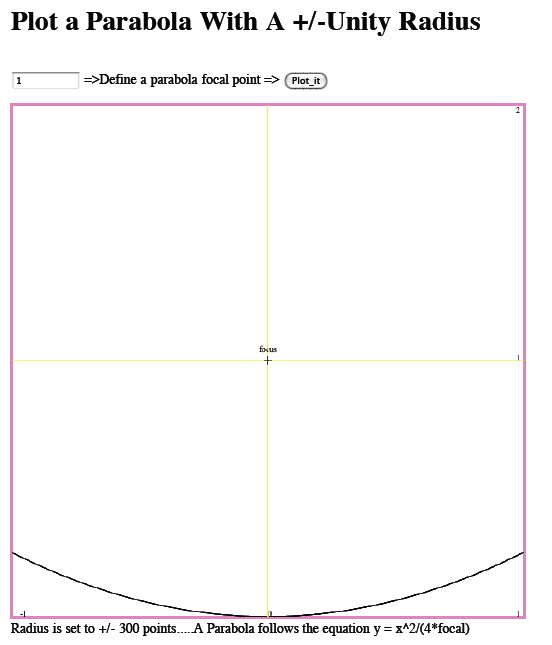
When the focal is 1, y will be 0.25 when x is one.
So X can be thought of as the radius of the parabola,
and y as being the depth.
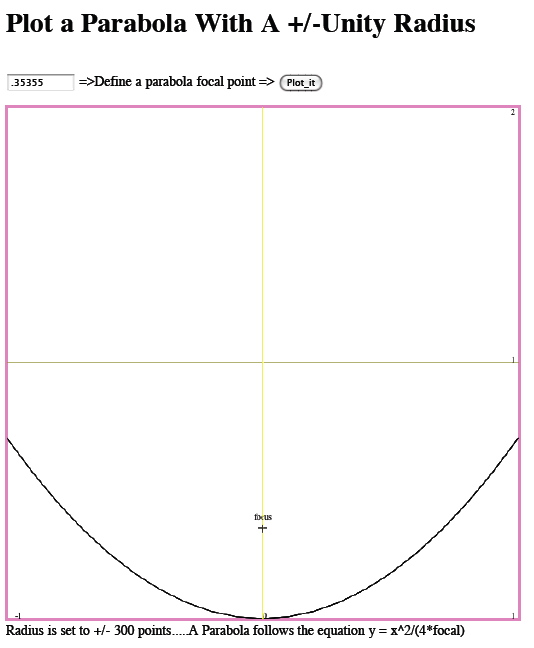
Some applications may want the focal point to be close
to one half the depth.

Making the focal length equal to sqrt(1/8) will do
the job.
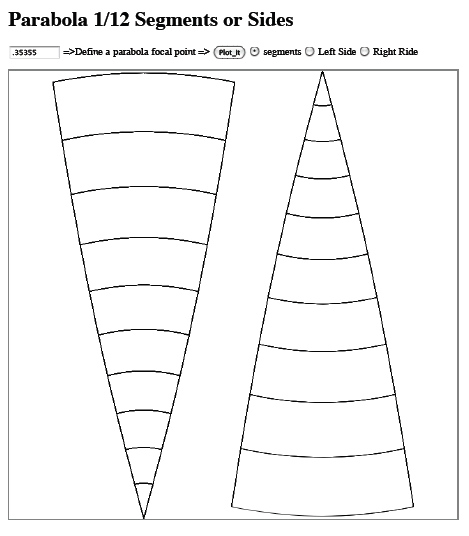
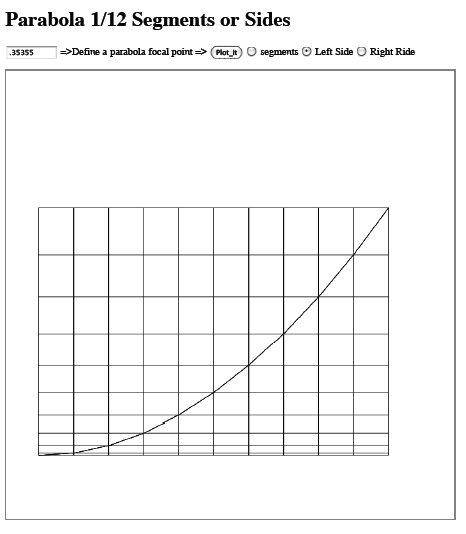
This same graphing feature can be extended to a web
page that can actually graph out the segments of
the parabola.
In this webpage, select a focal length and select
whether to plot segments or the parabola sides.
The parabola plots x as being step by
a consistent amount and the corresponding
y values displayed as lines.
The web pages have been designed to be able to
directly print out the curves on one page. Or
they can be saved as a pdf file.
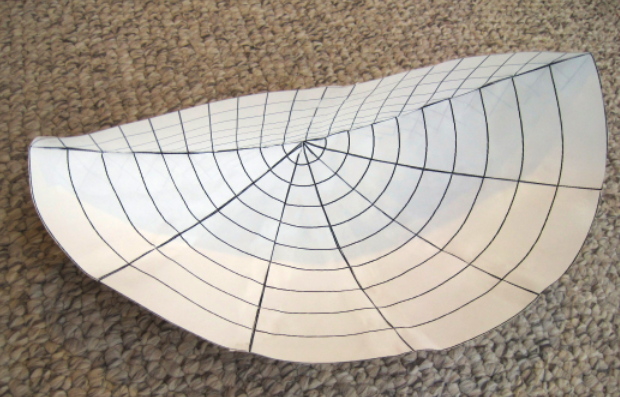
Print out three segments and the left and
right sides, then construct the parabola. This
will show how well everything lines up. All the
lines are present for alignment purposes.
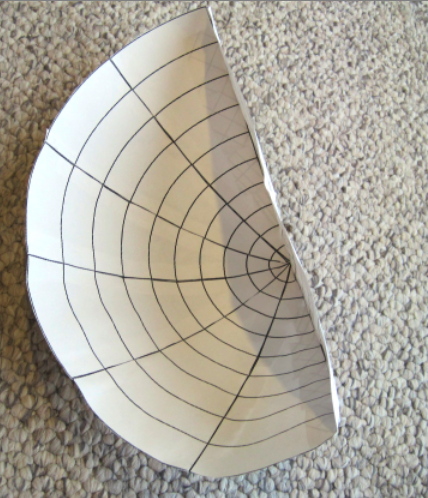
The segments have been designed to have a consistent
spacing in the x direction. The curve of the segments
will align themselves with both the x and y lines
on the left and right sides.
The web page is plotting everything on a 700x700 canvas.
Things have been simplified for a one page printout. Unlike
most plotting resources, the x and y are not seeing a funny
auto scale.
The plot is for now a bit map. The plot will define the shape
to a focal length relative to a radius. One could import the
plots into an application to do some size scaling. It should
be possible to build any size and shape of a parabola desired.