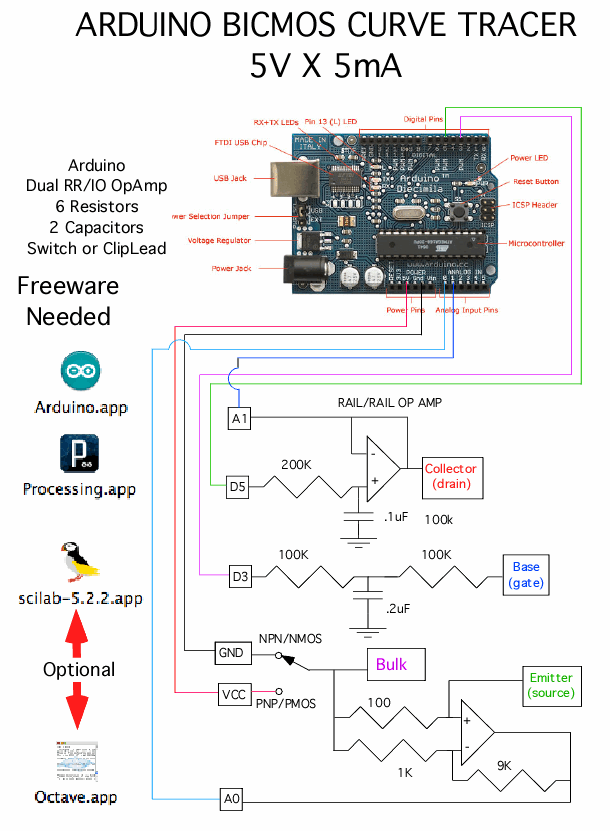
Arduino BiCMOS Curve Tracer
The curves above can be done with a Arduino board, a solderless
breadboard, a dual Rail to Rail Input/Output Op amp, a few
resistors and capacitors, and some free software. Everything
needed is shown below.
The graphs above are produced by either Scilab or Octave.
The curves are also viewed when using the Processing application.
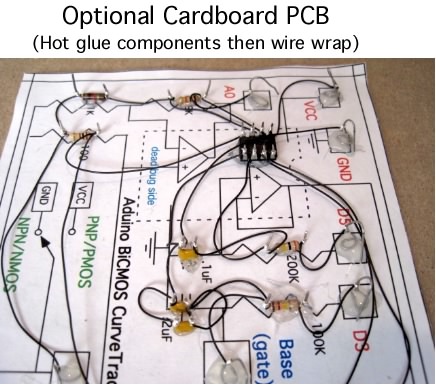
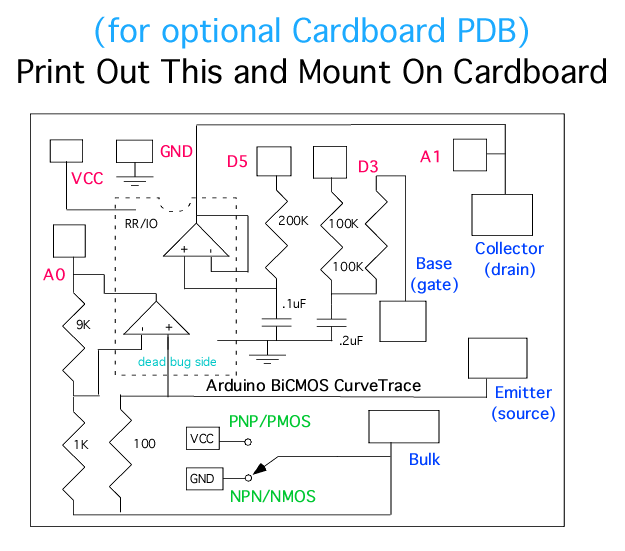
This is a circuit which may want to be used more than once.
Solderless bread boards are not usually meant for long term use.
An easy alternative is to build up a CardBoard printed circuit
board. This involves printing out a layout. Gluing the printout
to cardboard. Hot gluing all the components in place. Then
wire wrap up this simple circuit.
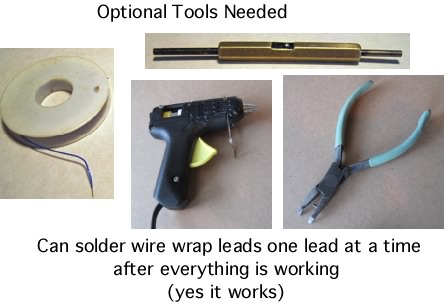
A hand wire wrap tool and wire wrap wire are needed to do this.
After the circuit is completely working, solder can be added to
all the wire wrap points. As long as only one lead of a component
is soldered at a time, melting the hot glue does not seem to
be much of a problem.
The layout for the CardBoard printed circuit board is
below.
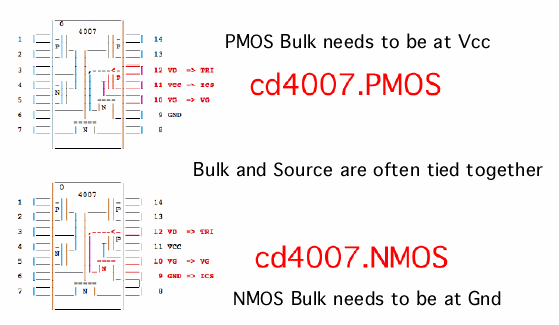
NMOS and PMOS transistors are hooked up the same as NPNs and PNPs.
Usually the bulk to CMOS transistors are connected to the source.
A Bulk terminal is provided otherwise. The same
NPN/PNP polarity
switch provides the proper Bulk voltage.

Open this application, then paste in the code below.
===============Curve_Tracer_Arduino_Code_Below===================
int tri = 5; // TriAngle Wave at D5
int vg = 3; // Voltage step port at D3
int j = 0; // Tri value
int k = 0; // Step Value
int slope = 4;
int incomingByte; // read incoming serial data into
void setup()
{ Serial.begin( 9600); // initialize serial communication:
pinMode( tri, OUTPUT);
pinMode( vg, OUTPUT);
} // setup
void loop()
{ if (Serial.available() > 0) // see if incoming serial data:
{ incomingByte = Serial.read(); // read oldest byte in serial buffer:
} // if (Serial.available() > 0)
if (incomingByte == 'H') // if H (ASCII 72), printoutput
{ delay( 10);
j = j+slope;
analogWrite( tri, j); // will be PWM 488 Hz
analogWrite( vg, k); // will be PWM 488 Hz
Serial.print( analogRead(0)); // read current at A0
Serial.print( " ");
Serial.println( analogRead(1)); // read tri voltage at A1
delay( 10); // to stabilize adc:
if (j > 251) slope = -4 ;
if (j < 1)
{ slope = 4 ;
k = k + int(255/5);
} // if (j > 251) slope = -4 ;
if (k > 255 ) k = 0 ;
} // if (incomingByte == 'H')
} // loop()
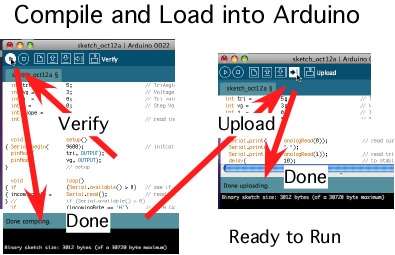
Then it is a simple matter of compiling the code and uploading
it to the hardware.
The same thing is true for Processing code. But this processing
code is also set up to be able to control the Arduino hardware.

Open this application, then paste in the code below.
================Curve_Tracer_Processing_Code======================
import processing.serial.*;
PrintWriter output; // output file
Serial myPort; // The serial port
int xPos = 1; // hor position graph
void setup ()
{ size( 300, 300); // set the window size:
println( Serial.list()); // List serial ports
myPort = new Serial(this, Serial.list()[0], 9600 ); // initialize to 9600 baud
myPort.bufferUntil('\n'); // serialEvent() @ \n:
background( 0); // set inital background:
println( "Click on image and hit s to start"); // will start serial data
println( "Hit w to write to file"); // dump to file ad stop
String file = String.valueOf(year());
file = file +"."+String.valueOf(month());
file = file +"."+String.valueOf(day());
file = file +"."+String.valueOf(hour());
file = file +"."+String.valueOf(minute());
file = file +"."+String.valueOf(second())+".mat";
println( file);
output = createWriter(file); // Sketch->Show_Sketch_fie
} // setup
void draw ()
{ if( keyPressed)
{ if (key == 's' || key == 'S')
{ myPort.write( "H");
} //if (key == 's' || key == 'S')
if (key == 'w' || key == 'W')
{ output.flush(); // Writes the remaining data to the file
output.close(); // Finishes the file
exit(); // Stops the program
} // if (key == 'w' || key == 'W')
} // if( keyPressed)
} // draw ()
void serialEvent (Serial myPort)
{ String inString = myPort.readStringUntil('\n'); // get the ASCII string:
if (inString != null)
{ inString = trim(inString); // trim whitespace:
int[] vv = int(split(inString, ' '));
// println( inString );
output.println( inString );
float val0 = float(vv[0]);
float val1 = float(vv[1]);
val0 = map(val0, 0, 1023, 0, height*.95);
val1 = map(val1, 0, 1023, 0, height*.95);
stroke( 127,34,255); // color to draw
line( val1, height - val0-1, val1+1, height - val0); // draw the line:
if (xPos >= 6*width)
{ xPos = 0; // auto redraw
background( 0);
} // if (xPos >= 2*width)
else
{ xPos= xPos+1;
} // else
} // if (inString != null)
} // serialEvent (Serial myPort)
After the code is pasted into the Processing window, hit the run
button. At first a list of serial ports gets printed out.
The Arduino board and the Processing application should be
using the same port be default. The available serial ports are
listed the the array Serial.list()[0]. The number 0 can be
changed to match the arduino port to the Processing port if
there is a problem.
It takes a while for the graph window to come up. When it does,
the curve tracing is started by first clicking the graph
window, and then typing "s".
The tracing of the transistor is a little slow because the analog
outputs of a Arduino are really low pass filter PWM digital
outputs at 488Hz.
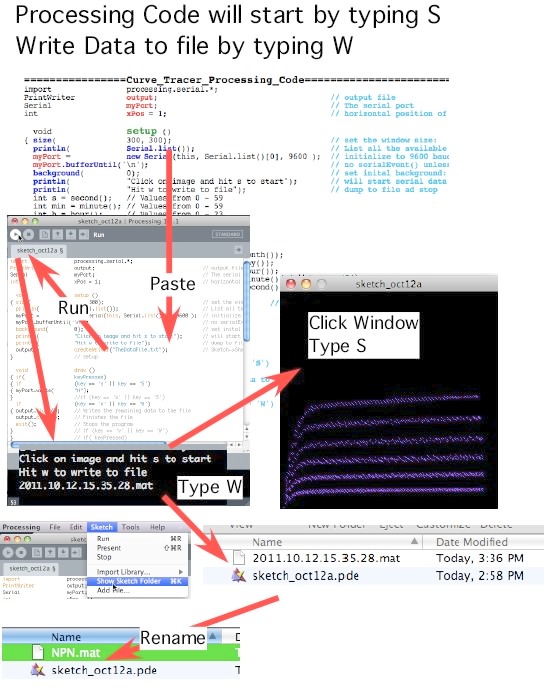
The Processing Code also writes the curve tracer data to a text
file. The Sketch/Show_Sketch_Folder menu will open up the proper
folder. The file initially gets named the exact time the data
was taken. Not a bad idea to rename that file.
The following are template text that can be copied and pasted
into a Scilab window to generate the plots. SciLab will need
to know where the data files are located. So the paths shown
below in light blue need to be set to the correct path.
Open this application, then paste in code below.
========Copy_Paste_Into_SciLab_Window===========================
z1 = read( '/Users/donsauer/Downloads/REF_SOURCE/WORK/curvetrace2/NPN.mat', -1, 2);
V = 4.88e-3*z1( : , 2);
I = 4.88e-3*z1( : , 1);
plot( V,I );
xgrid();
xtitle( "NPN_Ib_equal_5_5uA_steps","Collector_Voltage_V","Collector_Current_mA");
========Copy_Paste_Into_SciLab_Window===========================
z1 = read( '/Users/donsauer/Downloads/REF_SOURCE/WORK/curvetrace2/PNP.mat', -1, 2);
V = 5 -4.88e-3*z1( : , 2);
I = 5 -4.88e-3*z1( : , 1);
plot( V,I );
xgrid();
xtitle( "PNP_Ib_equal_5_5uA_steps","Collector_Voltage_V","Collector_Current_mA");
========Copy_Paste_Into_SciLab_Window===========================
z1 = read( '/Users/donsauer/Downloads/REF_SOURCE/WORK/curvetrace2/NMOS.mat', -1, 2);
V = 4.88e-3*z1( : , 2);
I = 4.88e-3*z1( : , 1);
plot( V,I );
xgrid();
xtitle( "NMOS_VG_equals_5_1Vsteps","Drain_Voltage_V","Drain_Current_mA");
========Copy_Paste_Into_SciLab_Window===========================
z1 = read( '/Users/donsauer/Downloads/REF_SOURCE/WORK/curvetrace2/PMOS.mat', -1, 2);
V = 5 -4.88e-3*z1( : , 2);
I = 5 -4.88e-3*z1( : , 1);
plot( V,I );
xgrid();
xtitle( "PMOS_VG_equals_5_1Vsteps","Drain_Voltage_V","Drain_Current_mA");
==============================================================
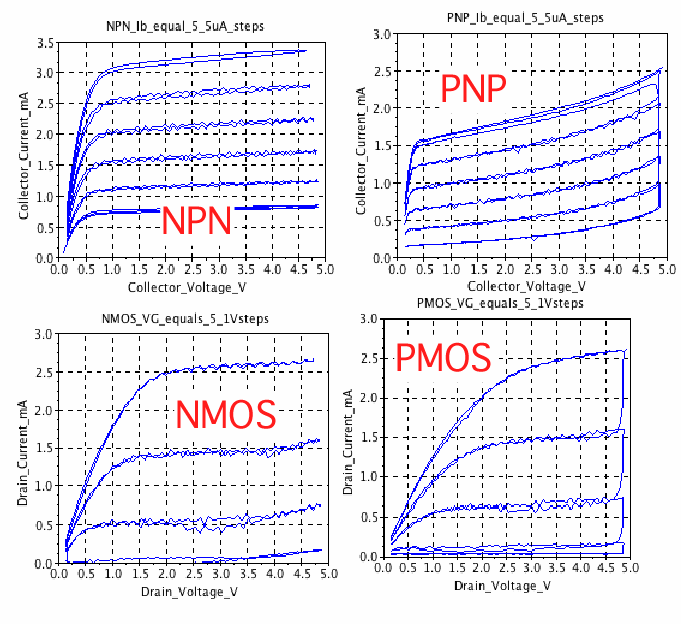
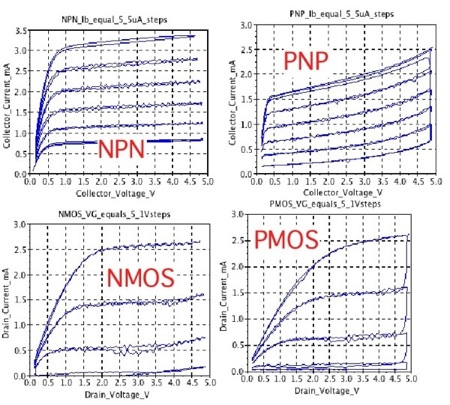
The templates are set up to translate the data into voltages
and currents. There are four templates for each type of
transistor. They produce the curves show below.

The templates for Octave are almost the same and are given below.
They produce the same curves.

Open this application, then paste in code below.
===========Cut_Paste_Into_Octave_Window===========================
load -ascii /Users/donsauer/Downloads/REF_SOURCE/WORK/curvetrace2/NPN.mat
V = 4.88e-3* NPN( : , 2);
I = 4.88e-3* NPN( : , 1);
plot( V,I );
grid
title ( "NPN Ib equal 5 5uA steps")
xlabel ( "Collector Voltage V")
ylabel ( "Collector Current mA")
===========Cut_Paste_Into_Octave_Window===========================
load -ascii /Users/donsauer/Downloads/REF_SOURCE/WORK/curvetrace2/PNP.mat
V = 5 -4.88e-3*PNP( : , 2);
I = 5 -4.88e-3*PNP( : , 1);
plot( V,I );
grid
title ( "PNP Ib equal 5 5uA steps")
xlabel ( "Collector Voltage V")
ylabel ( "Collector Current mA")
===========Cut_Paste_Into_Octave_Window===========================
load -ascii /Users/donsauer/Downloads/REF_SOURCE/WORK/curvetrace2/NMOS.mat
V = 4.88e-3*NMOS( : , 2);
I = 4.88e-3*NMOS( : , 1);
plot( V,I );
grid;
title ( "NMOS Vg equal 5 1V steps") ;
xlabel ( "Drain Voltage V");
ylabel ( "Drain Current mA");
===========Cut_Paste_Into_Octave_Window===========================
load -ascii /Users/donsauer/Downloads/REF_SOURCE/WORK/curvetrace2/PMOS.mat
V = 5 -4.88e-3*PMOS( : , 2);
I = 5 -4.88e-3*PMOS( : , 1);
plot( V,I );
grid
title ( "PMOS Vg equal 5 1V steps")
xlabel ( "Drain Voltage V")
ylabel ( "Drain Current mA")
=================================================================
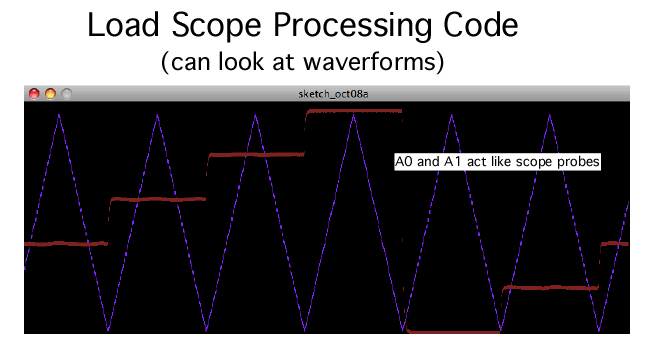
There is a free feature to the hardware. The curve tracer can
be converted into a dual trace oscilloscope by loading in some
different Processing code. The analog inputs A0 and A1 will
act like scope probes. These probes can be placed at different
places in the circuit to things like view things like triangle
and step waveforms. Simply copy and paste the following
Processing code. It starts up the same as the curve
tracer.
================Dual_Scope_Processing_Code========================
import processing.serial.*;
PrintWriter output; // output file
Serial myPort; // The serial port
int xPos = 1; // hor position graph
void setup ()
{ size( 800, 300); // set the window size:
println( Serial.list()); // List serial ports
myPort = new Serial(this, Serial.list()[0], 9600 ); // initialize to 9600 baud
myPort.bufferUntil('\n'); // serialEvent()newline ch
background( 0); // set inital background:
println( "Click on image and hit s to start"); // will start serial data
println( "Hit w to write to file"); // dump to file ad stop
output = createWriter("TheDataFile.txt"); // Sketch->Show_Sketch_fie
} // end
void draw ()
{ if( keyPressed)
{ if (key == 's' || key == 'S')
{ myPort.write( "H");
} //if (key == 's' || key == 'S')
if (key == 'w' || key == 'W')
{ output.flush(); // Writes the remaining data to the file
output.close(); // Finishes the file
exit(); // Stops the program
} // if (key == 'w' || key == 'W')
} // if( keyPressed)
} // draw ()
void serialEvent (Serial myPort)
{ String inString = myPort.readStringUntil('\n'); // get the ASCII string:
if (inString != null)
{ inString = trim(inString); // trim whitespace:
int[] vv = int(split(inString, ' '));
// println( inString );
output.println( inString );
float val0 = float(vv[0]);
float val1 = float(vv[1]);
val0 = map(val0, 0, 1023, 0, height*.95);
val1 = map(val1, 0, 1023, 0, height*.95);
stroke( 127,34,255); // set color draw
line( xPos, height - val0-6, xPos, height - val0-3); // draw line:
stroke( 127,34,32); // set color draw
line( xPos, height - val1-6, xPos, height - val1-3); // draw line:
if (xPos >= width)
{ xPos = 0; // if edge go back
background( 0);
} // if (xPos >= width)
else
{ xPos= xPos+1; // increment hor
} // else
} // if (inString != null)
} // serialEvent (Serial myPort)
=================================================================
It is possible to generate any kind of waveform at the "analog"
output ports as well.
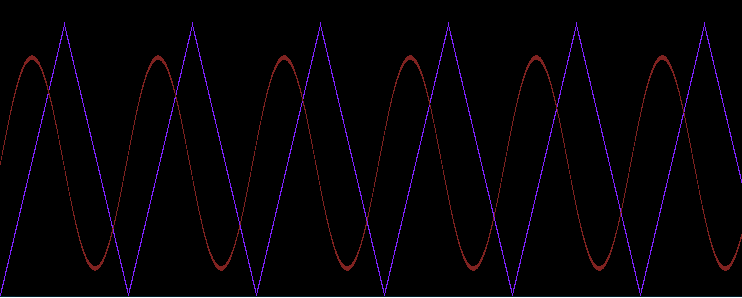
===============Sine_Generator_Arduino_Code========================
int incomingByte; // read incoming serial data
int slope = 4 ;
float x;
void setup()
{ Serial.begin( 9600); // set baud
} // setup() end
int j = 0;
void loop()
{ if (Serial.available() > 0) // see if incoming serial
{ incomingByte = Serial.read(); // read oldest byte in serial
} // if (Serial.available() > 0)
if (incomingByte == 'H') // if H (ASCII 72), printoutput
{ delay( 1000);
for (int i=0; i <= 2550; i++)
{ Serial.print( 4*j);
Serial.print( " ");
x = 3.14*i/63;
Serial.println( int(400*sin(x))+500);
delay( 50); // stabilize adc:
j = j+slope;
if (j > 254) slope = -4 ;
if (j < 1) slope = 4 ;
} // for (int i=0; i <= 2550; i++)
} // if (incomingByte == 'H')
} // loop()
Conclusion...
The analog input/output ports of the Arduino, together with some
support hardware, and free online software, makes it easy to build
an automated analog test interface with a laptop.
10.14.11_1.18PM
dsauersanjose@aol.com
Don Sauer